


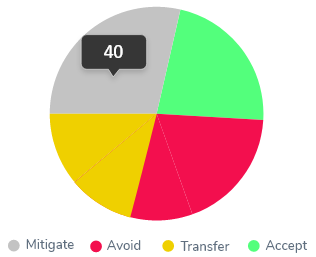
No. of Risk
Threat
Opportunity
Pending for
Approval
Pending for
Assessment
Pending for
Treatment
Risk Identified
Total Control
| Low | 5 | |||||||||||||
|---|---|---|---|---|---|---|---|---|---|---|---|---|---|---|
| Medium | 6 | |||||||||||||
| Significant | 3 | |||||||||||||
| High | ||||||||||||||
| Very High | 1 | 1 | ||||||||||||
| 1 | 2 | 3 | 4 | 5 | 6 | 8 | 9 | 10 | 12 | 15 | 16 | 20 | 25 | |
| Low | 5 | |||||||||||||
|---|---|---|---|---|---|---|---|---|---|---|---|---|---|---|
| Medium | 6 | |||||||||||||
| Significant | 3 | |||||||||||||
| High | ||||||||||||||
| Very High | 1 | 1 | ||||||||||||
| 1 | 2 | 3 | 4 | 5 | 6 | 8 | 9 | 10 | 12 | 15 | 16 | 20 | 25 | |
Risk
Action Plans
| Action Plan Due | Open | In process | Treated | Closed |
|---|---|---|---|---|
| 0-90 Days | 3 | 4 | 3 | 2 |
| 91-365 Days | 10 | 8 | 6 | 5 |
| 181-365 Days | 3 | 1 | 1 | 2 |
| 1-2 Years | 16 | 13 | 10 | 9 |
| Above 2 Years | 16 | 13 | 10 | 9 |
Supplier must have ISO 9001 certification
Inherent
Residual
5 years experience in government projects
Inherent
Residual
5 years experience in government projects
Inherent
Residual
5 years experience in government projects
Inherent
Residual
5 years experience in government projects
Inherent
Residual
5 years experience in government projects
Inherent
Residual
Supplier must have ISO 9001 certification
Extreme
5 years experience in government projects
Very High
5 years experience in government projects
High
5 years experience in government projects
Medium
5 years experience in government projects
Low
5 years experience in government projects
Very Low
 5
5
 X
X
 X
X


Can’t find what you need, or have some feedback?